- Home >
- Test papers >
MCQ on Principles of titrimetric analysis: Page-1
How many significant figures are present in the following values?

(A) P has 3 and Q has 5
(B) P has 5 and Q has 3
(C) Both P and Q have 3
(D) Both P and Q have 5
In a UV-visible spectrophotometric analysis, the absorbance and concentrations are correlated by using least squares method and regression coefficient is obtained as follows. The data indicates the plot as

(A) Perfect straight line
(B) Not a perfect straight line
(C) Can’t be predicted
(D) Sigmoid curve
How many significant figures are present in 0.0004
(A) 1
(B) 4
(C) 5
(D) 3
Calculate the degree of hydrolysis of the following salt

(A) 1
(B) 0.01
(C) 0.001
(D) 0.0001
Which of the following can minimize the systematic errors
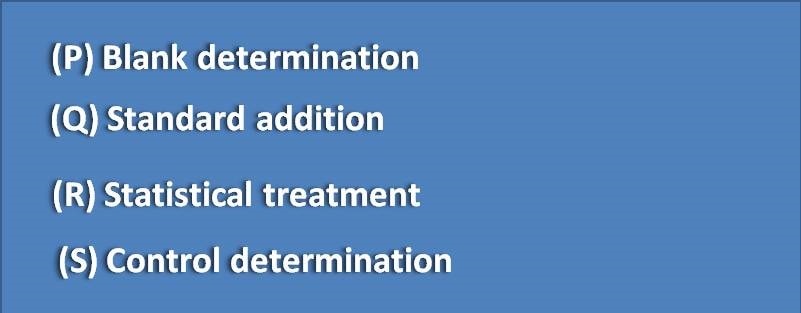
(A) P,S
(B) Q,R
(C) P,Q,S
(D) P,Q,R,S